The top dividend yields right now: who is safe and who is a trap
High yields often signal market distress. We evaluate the sustainability of current payouts for top-yielding assets in the current economic climate.

Why these yields right now
High dividend yields are currently driven by a combination of sector-specific headwinds and broader macroeconomic shifts. Investors are demanding higher premiums for holding assets in capital-intensive industries like telecommunications and asset management.
The current yield environment reflects a market repricing of risk. When stock prices decline, yields mathematically rise, creating an illusion of value that requires deep fundamental analysis to verify.
The top yielders
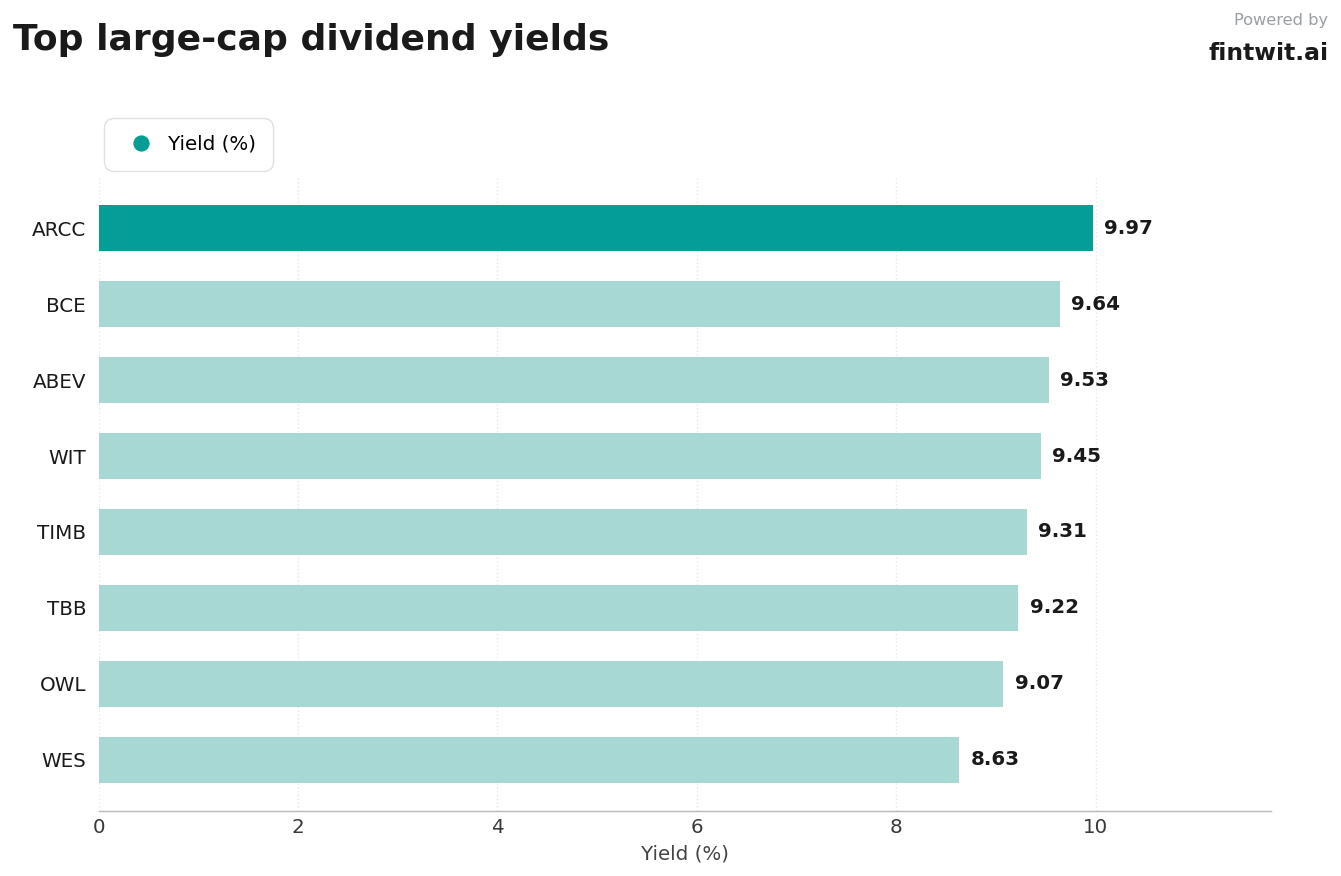
The following list represents a cross-section of high-yield equities currently trading on major exchanges. These figures are based on current market pricing and trailing dividend distributions.
Investors should prioritize payout ratios over raw yield percentages to assess long-term viability.
- Ares Capital (ARCC): 9.97% yield, payout ratio varies by BDC structure, safety rating: moderate.
- BCE Inc (BCE): 9.64% yield, 43% FCF-based payout ratio, safety rating: improved post-reset.
- Ambev SA (ABEV): 9.53% yield, payout ratio fluctuates with regional currency, safety rating: stable.
- Wipro Limited (WIT): 9.45% yield, payout ratio reflects tech sector reinvestment, safety rating: moderate.
- TIM Participacoes (TIMB): 9.31% yield, payout ratio aligns with telecom peers, safety rating: stable.
- AT&T Inc (TBB): 9.22% yield, payout ratio reflects debt management, safety rating: moderate.
- Blue Owl Capital (OWL): 9.07% yield, payout ratio reflects growth phase, safety rating: speculative.
- Western Midstream (WES): 8.63% yield, payout ratio supported by energy cash flows, safety rating: strong.
Yield traps
A yield trap occurs when a high dividend is unsustainable and likely to be cut. Investors often mistake a falling share price for a buying opportunity, failing to see the underlying balance sheet deterioration.
BCE Inc serves as a primary example of a recent dividend reset. The company moved to prioritize debt reduction over dividend growth, ending a long-term streak.
- BCE Inc (BCE): Recent 56% dividend cut in 2025; growth paused to prioritize debt reduction.
- Wipro Limited (WIT): Significant share price decline of 27.27% over the past year raises questions about capital allocation sustainability.
- Blue Owl Capital (OWL): Share price volatility of -49.69% over 12 months suggests market skepticism regarding future payout coverage.
Build an income sleeve
Constructing a resilient income sleeve requires diversification across sectors to mitigate the impact of a single dividend cut. Relying on a single industry, such as telecom, exposes the portfolio to systemic regulatory and interest rate risks.
Focus on companies with a payout ratio between 40% and 55% of free cash flow. This range typically provides enough buffer to maintain dividends during cyclical downturns while allowing for reinvestment.
- Target a mix of BDCs, midstream energy, and consumer defensive stocks to balance yield and stability.
- Monitor quarterly free cash flow reports to ensure the dividend remains covered by operational cash rather than debt issuance.
- Rebalance the sleeve semi-annually to trim positions that have seen their payout ratios drift above 60%.