The Top Dividend Yields Right Now: Who Is Safe and Who Is A Trap
High yields often signal distress. We break down the top dividend payers to identify which are sustainable and which are potential traps.

Why these yields right now
Market volatility has pushed dividend yields for several major companies above the 9% threshold. This phenomenon is driven by a combination of sector-specific headwinds and broader macroeconomic pressures on capital-intensive industries.
Investors are increasingly forced to choose between yield and capital preservation. A high yield is only beneficial if the underlying dividend remains intact and the share price does not erode faster than the income generated.
The current landscape requires a granular look at cash flow coverage rather than headline yield percentages. Companies that have recently reset their dividends, such as BCE, are attempting to balance shareholder returns with the massive capital expenditures required for 5G and fiber infrastructure.
The top yielders
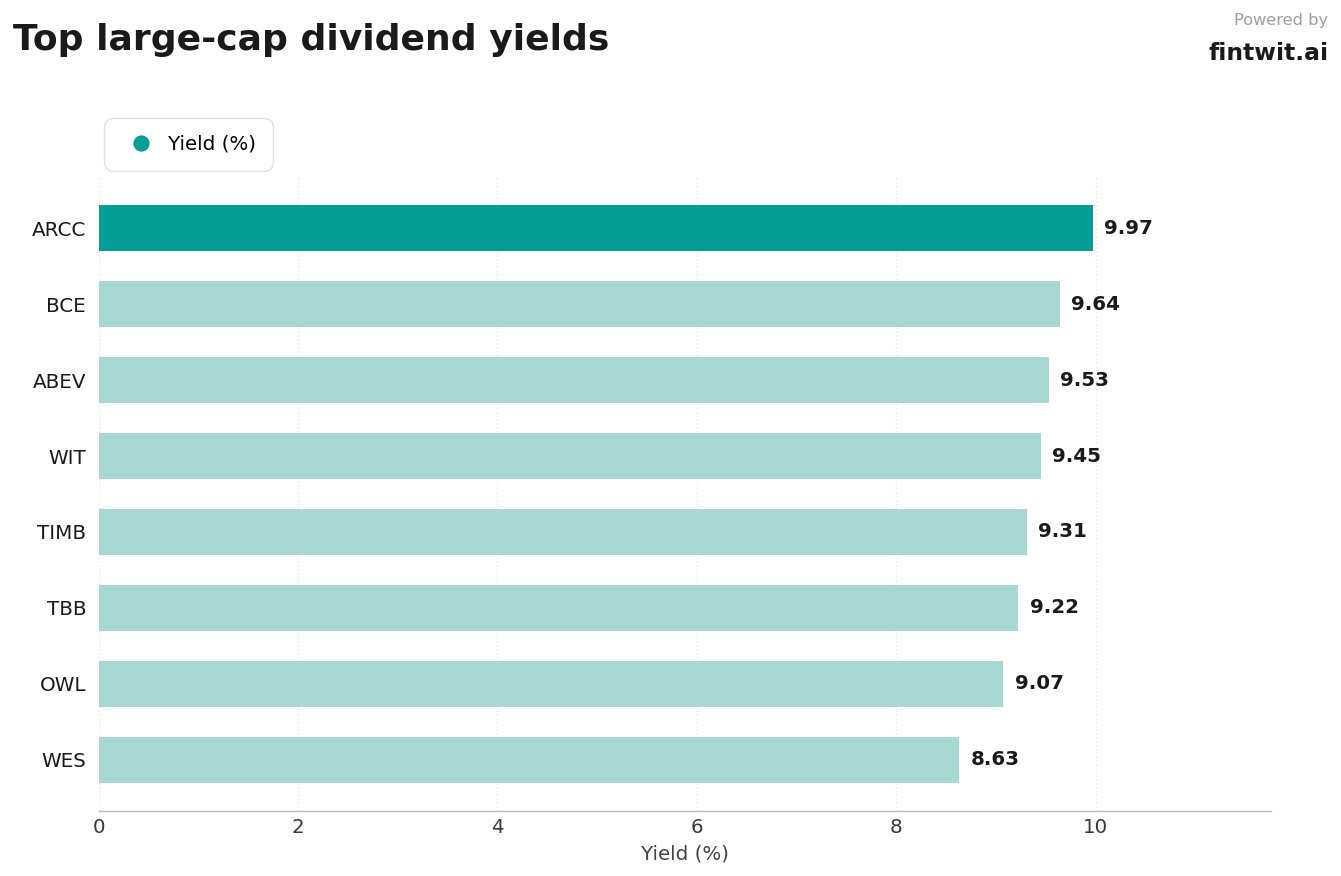
The following list highlights companies currently yielding over 9% based on recent market data. We assess these based on their payout ratios and overall safety profiles.
Investors should note that a high payout ratio, particularly one exceeding 100%, is a primary indicator of potential dividend instability.
- Ares Capital (ARCC): 9.97% yield, 117.79% payout ratio, Low safety.
- BCE Inc (BCE): 9.64% yield, 68.11% payout ratio, Moderate safety.
- Ambev SA (ABEV): 9.53% yield, 10.53% payout ratio, High safety.
- Wipro Limited (WIT): 9.45% yield, 87.29% payout ratio, Moderate safety.
- TIM Participacoes (TIMB): 9.31% yield, 119.32% payout ratio, Low safety.
- AT&T Inc (T): 9.22% yield, 37.25% payout ratio, High safety.
- Blue Owl Capital (OWL): 9.07% yield, 107-108% payout ratio, Low safety.
- Western Midstream (WES): 8.63% yield, 121.57% payout ratio, Moderate safety.
Yield traps
A yield trap occurs when a stock's high dividend yield is a symptom of a declining business model or unsustainable financial practices. When a company pays out more than it earns, the dividend is effectively being funded by debt or asset liquidation.
The following tickers exhibit high risk flags due to payout ratios that exceed earnings or cash flow generation capacity.
- ARCC: Payout ratio of 117.79% suggests the current dividend level is unsustainable without significant NAV growth.
- TIMB: Payout ratio of 119.32% indicates that the company is paying out more than its net income, raising long-term viability concerns.
- OWL: Payout ratio exceeding 100% despite management's 85% target indicates a disconnect between current distributions and operational earnings.
Build an income sleeve
Constructing a resilient income portfolio requires prioritizing companies with strong free cash flow coverage. AT&T (T) stands out with a 2.38x FCF coverage ratio, making its 9.22% yield significantly more reliable than those of its peers with higher payout ratios.
Ambev (ABEV) offers a unique profile with a low 10.53% earnings-based payout ratio, providing substantial room for dividend growth or stability during economic downturns.
Investors should aim to diversify across sectors to mitigate the impact of industry-specific regulatory or capital expenditure shocks.