NVIDIA Corporation (NVDA) vs Advanced Micro Devices (AMD): The 2026 AI Buy
NVIDIA and AMD are the primary engines of the AI revolution. We break down the financials and competitive positioning to see which stock holds more value.
The matchup
The semiconductor industry is currently defined by the race to supply hyperscalers with high-performance compute. NVIDIA has successfully built a full-stack ecosystem that integrates hardware, networking, and the CUDA software layer, creating significant switching costs for enterprise clients.
AMD is aggressively challenging this position by leveraging chiplet innovation and strategic partnerships with major cloud providers like Meta. The company is focused on scaling its MI450 and Helios product lines to capture server CPU and AI accelerator market share.
- NVIDIA moat: Full-stack dominance via CUDA, NVLink, and proprietary networking software.
- AMD moat: Strong product execution and growing hyperscaler adoption of open-standard hardware.
- Baird maintains a bullish view on NVIDIA with a $500 price target.
- Bank of America analyst Vivek Arya holds a bullish rating on AMD with a $560 price target.
Numbers side by side
Financial performance reveals a divergence in profitability and valuation metrics between the two firms. NVIDIA operates with superior GAAP gross margins of approximately 75%, compared to AMD's 53-55% range.
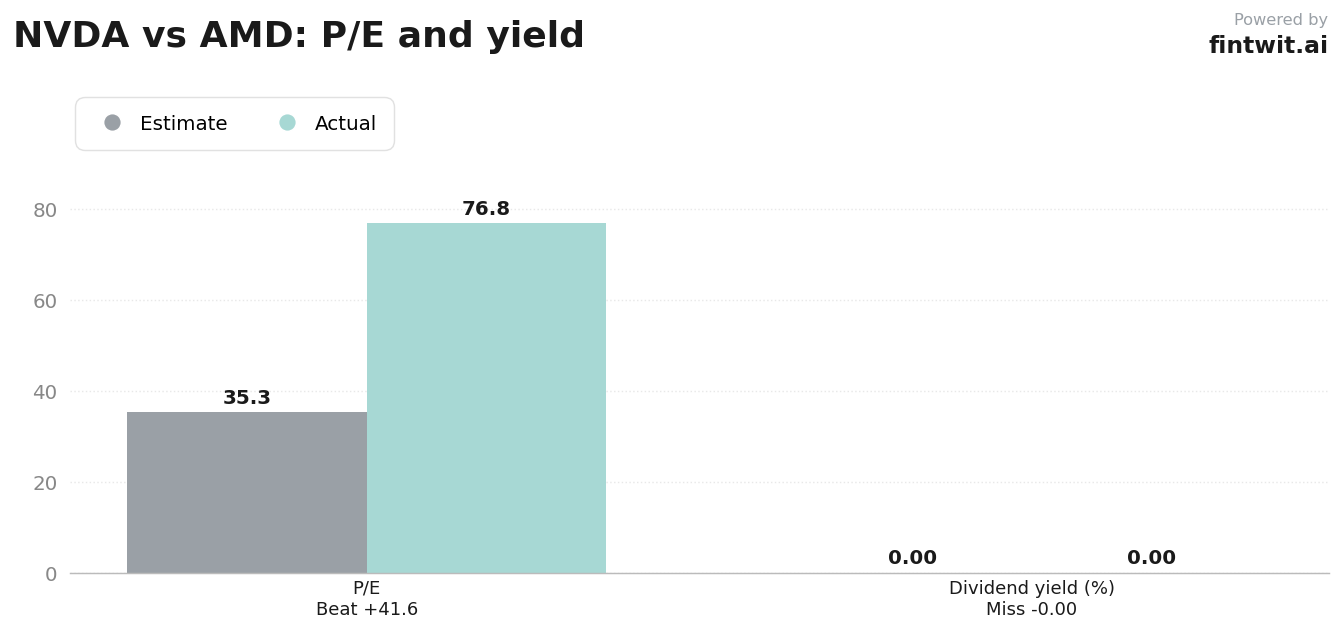
Valuation remains a critical factor for investors, as AMD trades at a higher P/E ratio despite lower overall revenue growth compared to NVIDIA's current trajectory.
- NVIDIA P/E Ratio: 35.29
- AMD P/E Ratio: 76.84
- NVIDIA Revenue Growth: 85% YoY (Q1 2026)
- AMD Revenue Growth: 38% YoY (Q1 2026)
- NVIDIA 1-year return: 44.53%
- AMD 1-year return: 340.40%
Bull and bear on each
The bull case for NVIDIA centers on the upcoming Blackwell and Rubin product cycles, which are expected to sustain its lead in AI infrastructure. Conversely, the bear case highlights potential margin compression and the geopolitical risks associated with US-China export controls.
AMD's bull case is built on the assumption of significant share gains in the server CPU market and increased operating leverage as AI revenue scales. The bear case focuses on the execution risks inherent in new product ramps and the premium valuation that leaves little room for error.
- NVIDIA Bull: Continued dominance in agentic AI and robotics software.
- NVIDIA Bear: Normalization of AI demand and supply chain dependency.
- AMD Bull: Stronger-than-expected adoption by major cloud providers.
- AMD Bear: Premium valuation in a cyclical semiconductor market.
The verdict
Choosing between these two leaders requires an assessment of whether one prioritizes the stability of a dominant ecosystem or the growth potential of a challenger. NVIDIA offers a more durable foundation for long-term AI leadership due to its unmatched software-hardware integration.
AMD remains a compelling alternative for investors seeking exposure to multi-vendor strategies, particularly if hyperscalers aggressively diversify their supply chains away from NVIDIA. The path forward depends on execution speed during the next major product refresh cycle.