The Top Dividend Yields Right Now: Who Is Safe and Who Is a Trap
High yields often signal high risk. We evaluate the sustainability of top dividend payers to help you separate reliable income from potential traps.

Why these yields right now
Market volatility and sector-specific headwinds have pushed dividend yields for several companies into the 8% to 10% range. Investors are increasingly looking for income as interest rates remain elevated, yet the risk of dividend cuts has never been higher for over-leveraged firms.
The primary driver of these elevated yields is often a declining share price rather than a deliberate increase in payout. When a stock price drops, the yield mathematically expands, creating a deceptive appearance of value for income-focused portfolios.
- Telecom sector yields are currently inflated due to aggressive debt reduction mandates and competitive pricing pressures.
- Asset managers in the private credit space, such as ARCC and OWL, are seeing yield expansion as interest rate sensitivity impacts their underlying loan portfolios.
- Energy midstream providers like WES maintain high yields through MLP structures that prioritize cash distribution over capital appreciation.
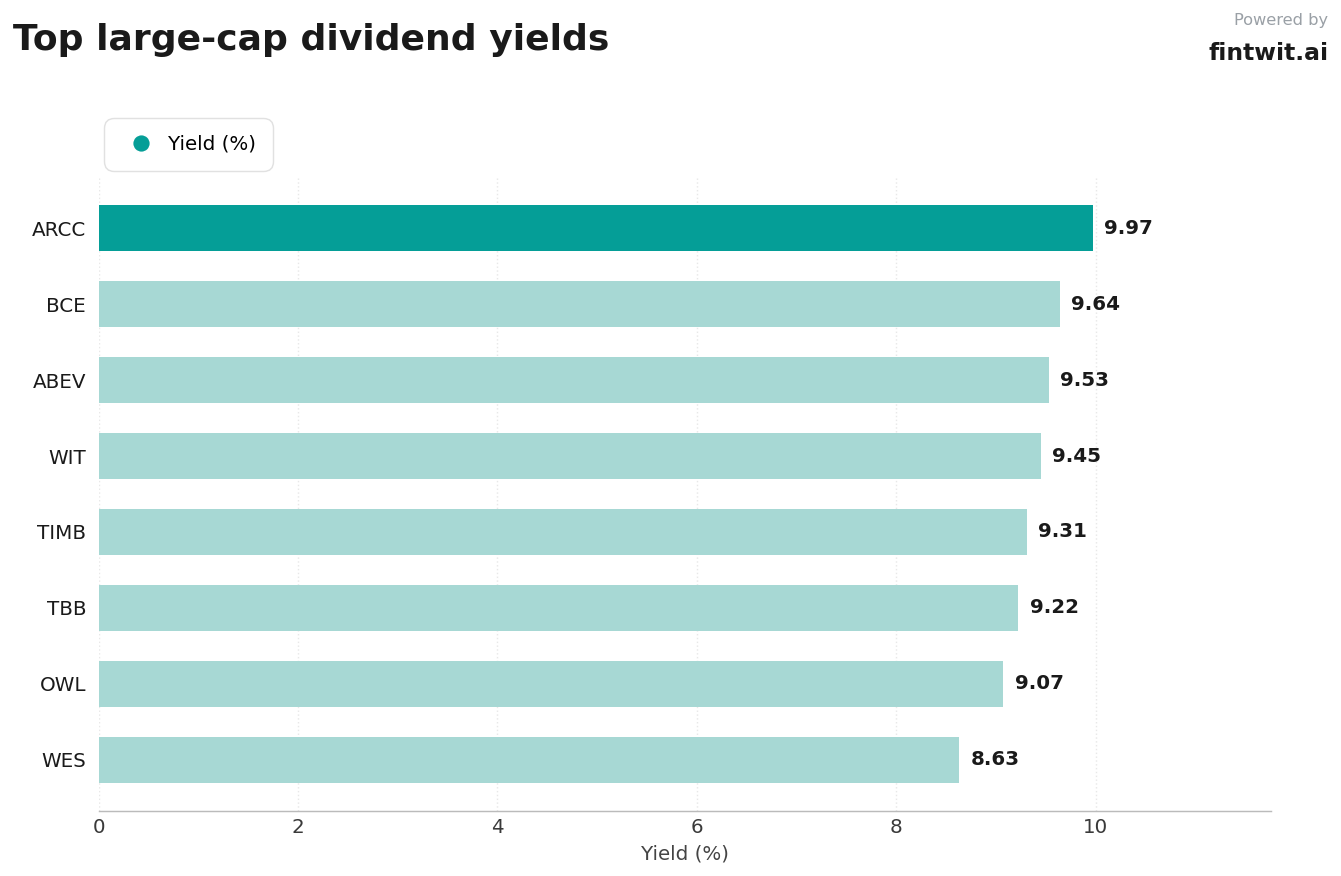
The top yielders
The following companies represent the highest current yields in our dataset. Safety ratings are based on the alignment between current dividend payouts and available free cash flow.
Investors should note that a payout ratio exceeding 100% is a red flag, indicating that the company is paying out more in dividends than it earns in net income.
- ARCC: 9.97% yield, 113.13% payout ratio, Moderate safety rating.
- BCE: 9.64% yield, 40-55% payout ratio (target), Improved safety rating.
- ABEV: 9.53% yield, 57.89% payout ratio, High safety rating.
- WIT: 9.45% yield, 86.69% payout ratio, Moderate safety rating.
- TIMB: 9.31% yield, 141.92% payout ratio, Low safety rating.
- T: 9.22% yield, 21.80% payout ratio (cash flow), High safety rating.
- OWL: 9.07% yield, ~100% payout ratio, Moderate safety rating.
- WES: 8.63% yield, 98% payout ratio (cash flow), Moderate safety rating.
Yield traps
A yield trap occurs when a high dividend is unsustainable and likely to be cut, leading to both a loss of income and a decline in share price. Identifying these requires looking beyond the yield to the underlying financial health of the issuer.
Companies with payout ratios consistently above 100% or those relying on special, non-recurring dividends are the most common culprits.
- TIMB: High risk due to an unsustainable 141.92% payout ratio and heavy reliance on volatile special dividends.
- ARCC: High risk due to sensitivity to interest rate fluctuations and a payout ratio that currently exceeds 113%.
- WIT: Moderate risk as the 86.69% payout ratio leaves very little buffer for earnings misses or operational downturns.
Build an income sleeve
Constructing a resilient income sleeve requires diversifying across sectors to mitigate the impact of a single dividend cut. Focus on companies where the payout ratio is supported by consistent free cash flow rather than accounting earnings.
Prioritize firms that have demonstrated a commitment to dividend maintenance even during periods of market stress. For instance, AT&T's current 21.80% cash flow payout ratio suggests a high degree of safety compared to its peers.
- Target a blended payout ratio of under 60% across the entire income portfolio.
- Monitor the ex-dividend dates, such as the June 15, 2026, date for ARCC, to ensure timely reinvestment.
- Rebalance positions quarterly to ensure that no single high-yield stock dominates the total portfolio allocation.