The Home Depot Inc (HD) vs Lowe's Companies Inc (LOW): Which Is the Better Buy?
HD and LOW are fighting for dominance in a stagnant housing market. We break down the financials, analyst sentiment, and growth catalysts for both.
The matchup
The home improvement sector is currently defined by a tug-of-war between long-term housing demand and short-term cyclical stagnation. Both companies are aggressively pursuing the professional contractor segment to offset the decline in DIY spending.
Home Depot has leaned heavily into large-scale acquisitions like SRS and GMS to build a moat around the Pro ecosystem. Conversely, Lowe's is focusing on its 'Total Home' strategy and AI-driven digital tools to capture market share.
- Home Depot (HD) is prioritizing massive scale and specialty trade integration to secure long-term recurring revenue.
- Lowe's (LOW) is emphasizing Pro penetration, which has reached approximately 40% of its total sales.
- Both firms are currently navigating compressed operating margins due to the integration of recent acquisitions.
- Housing turnover remains the primary external variable influencing revenue growth for both retailers.
Numbers side by side
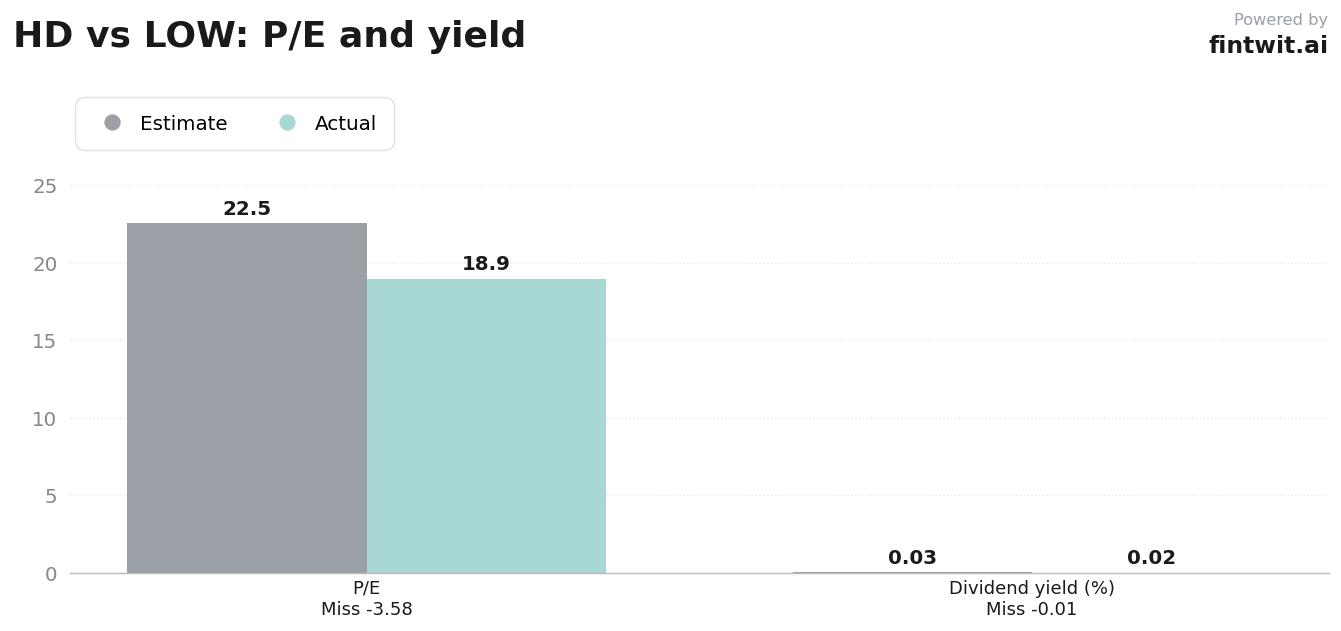
Valuation metrics reveal a distinct divergence in how the market prices these two competitors. Lowe's currently trades at a more attractive earnings multiple, providing a potential margin of safety for investors.
Revenue growth figures highlight the impact of recent strategic shifts. While Home Depot shows steady growth, Lowe's recent 10.5% YoY revenue increase suggests its current initiatives are gaining traction more rapidly.
- P/E Ratio: Home Depot (22.52) vs. Lowe's (18.94).
- Revenue Growth: Home Depot (4.8% YoY) vs. Lowe's (10.5% YoY).
- Dividend Yield: Home Depot (2.81%) vs. Lowe's (2.07%).
- 1-Year Price Performance: Home Depot (-9.98%) vs. Lowe's (-2.93%).
- Operating Margins: Home Depot (~12%) vs. Lowe's (~11.9%).
Bull and bear on each
The investment thesis for both companies rests on their ability to weather the current high-interest-rate environment. Analysts remain divided on whether scale or agility will win the next phase of the cycle.
Market participants are closely watching how each firm manages its capital allocation. Home Depot's aggressive M&A strategy contrasts sharply with the more internal, productivity-focused approach at Lowe's.
- HD Bull Case: Pro-focused acquisitions create a resilient, recurring revenue base less dependent on cyclical DIY spending.
- HD Bear Case: High interest rates and housing stagnation continue to suppress big-ticket renovation demand.
- LOW Bull Case: Successful 'Total Home' strategy and 15.5% online growth are driving share gains.
- LOW Bear Case: High sensitivity to housing turnover limits visibility on a near-term recovery.
- Analyst Take (HD): UBS maintains a $450 target, while Wolfe Research has downgraded the stock.
- Analyst Take (LOW): JP Morgan maintains an Overweight rating with a $279 price target.
The verdict
Choosing between these two giants requires a decision on whether you prefer the dominant scale of the industry leader or the valuation and operational momentum of the challenger. Both companies are well-positioned to benefit from any eventual recovery in housing turnover.
Investors should monitor the integration of recent acquisitions as a key indicator of future margin expansion. The current divergence in P/E ratios suggests that the market is still pricing in significant risk for both, though one appears to be navigating the transition with more efficiency.