Costco Wholesale Corp (COST) vs Target Corporation (TGT): 2026 Retail Analysis
Costco and Target are diverging in 2026. We break down the membership-driven model of COST against the turnaround strategy at TGT.
The matchup
Costco operates on a high-renewal membership model that consistently delivers over 90% retention rates. This creates a predictable revenue stream that insulates the company from broader consumer discretionary cycles.
Target is currently executing a multi-year $6 billion investment strategy aimed at store modernization and digital integration. The company is shifting its focus toward high-margin retail media via its Roundel platform and the Circle 360 membership program.
- Costco revenue growth: 11.6% YoY as of Q3 FY2026.
- Target revenue growth: 6.7% YoY as of Q1 FY2026.
- Costco moat: Exclusive Kirkland Signature brand and extreme operational scale.
- Target moat: Curated in-store experience and integrated omnichannel delivery.
Numbers side by side
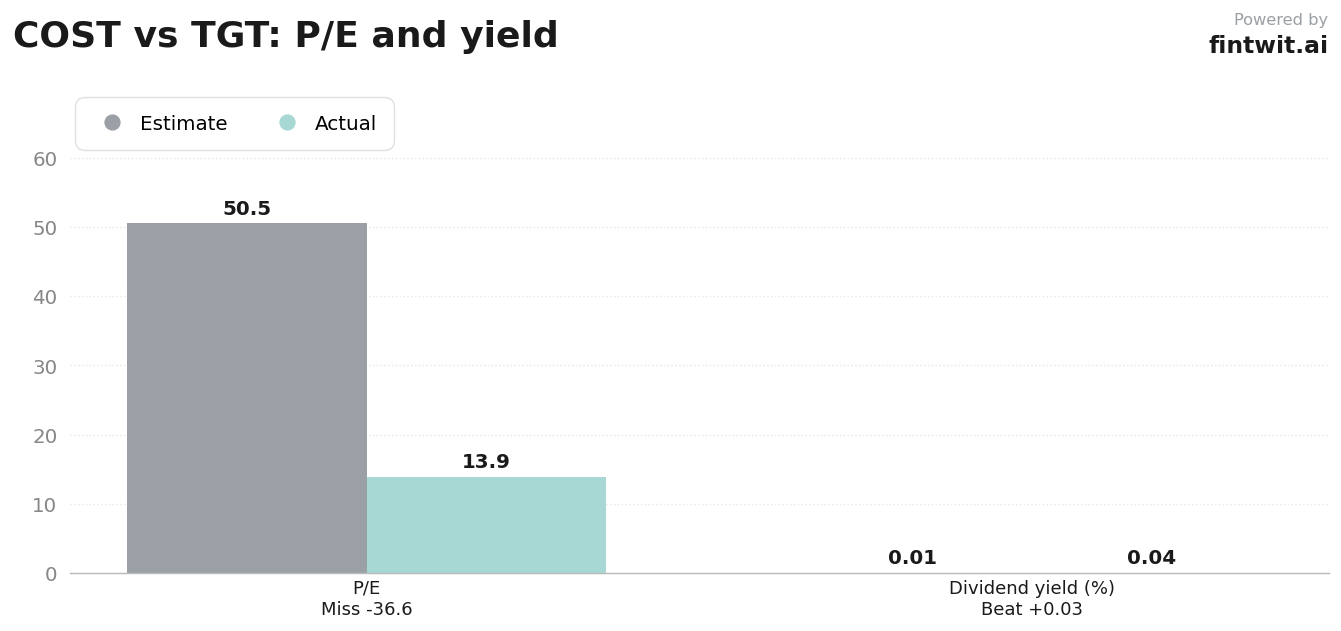
Valuation metrics highlight the disparity between Costco's premium growth profile and Target's value-oriented turnaround play. Costco commands a P/E ratio of 50.51, reflecting investor confidence in its consistent membership fee growth.
Target trades at a significantly lower P/E of 13.93, offering a higher dividend yield of 3.95% compared to Costco's 0.53%.
The following data illustrates the fundamental differences in market positioning and investor sentiment.
- Market Cap: COST ($431.59B) vs TGT ($51.29B).
- P/E Ratio: COST (50.51) vs TGT (13.93).
- Dividend Yield: COST (0.53%) vs TGT (3.95%).
- 90-Day Performance: COST (-6.31%) vs TGT (+5.44%).
- 1-Year Performance: COST (-0.05%) vs TGT (+28.98%).
Bull and bear on each
Analysts remain divided on the near-term trajectory for both retailers based on macroeconomic sensitivity and valuation concerns.
The bull case for Costco centers on its resilient membership base, while the bear case focuses on its stretched valuation multiples.
- COST Bull: Consistent membership fee income and 21.5% digital sales growth in Q3.
- COST Bear: Stretched P/E of 50x and potential tariff impacts on import-heavy categories.
- COST Analyst Takes: Zhihan Ma (Bernstein) Outperform $1,194; Oliver Chen (TD Cowen) Buy $1,175; Christopher Horvers (JP Morgan) Overweight $1,100.
- TGT Bull: $6B turnaround plan and growth in high-margin retail media.
- TGT Bear: Vulnerability to discretionary spending shifts and high exposure to tariff-sensitive goods.
- TGT Analyst Takes: MarketBeat Consensus Hold/Neutral $132.15; Brett Husslein (Morningstar) Neutral.
The verdict
Costco remains the preferred choice for investors prioritizing revenue visibility and defensive resilience. Its ability to maintain margins through disciplined markups provides a structural advantage that Target is still working to replicate through its transformation efforts.
Target offers a compelling value proposition if the $6 billion turnaround succeeds in driving sustained margin expansion. The stock's lower valuation provides a margin of safety for investors willing to bet on a rebound in discretionary spending.