The Cheapest Large Caps Right Now: A P/E Screen
A deep dive into large-cap stocks with low P/E ratios, separating fundamental value from potential traps.

How we screened
We filtered for companies with market capitalizations exceeding $10 billion to ensure liquidity and institutional coverage. We then ranked these by trailing P/E ratios to isolate the cheapest segments of the market.
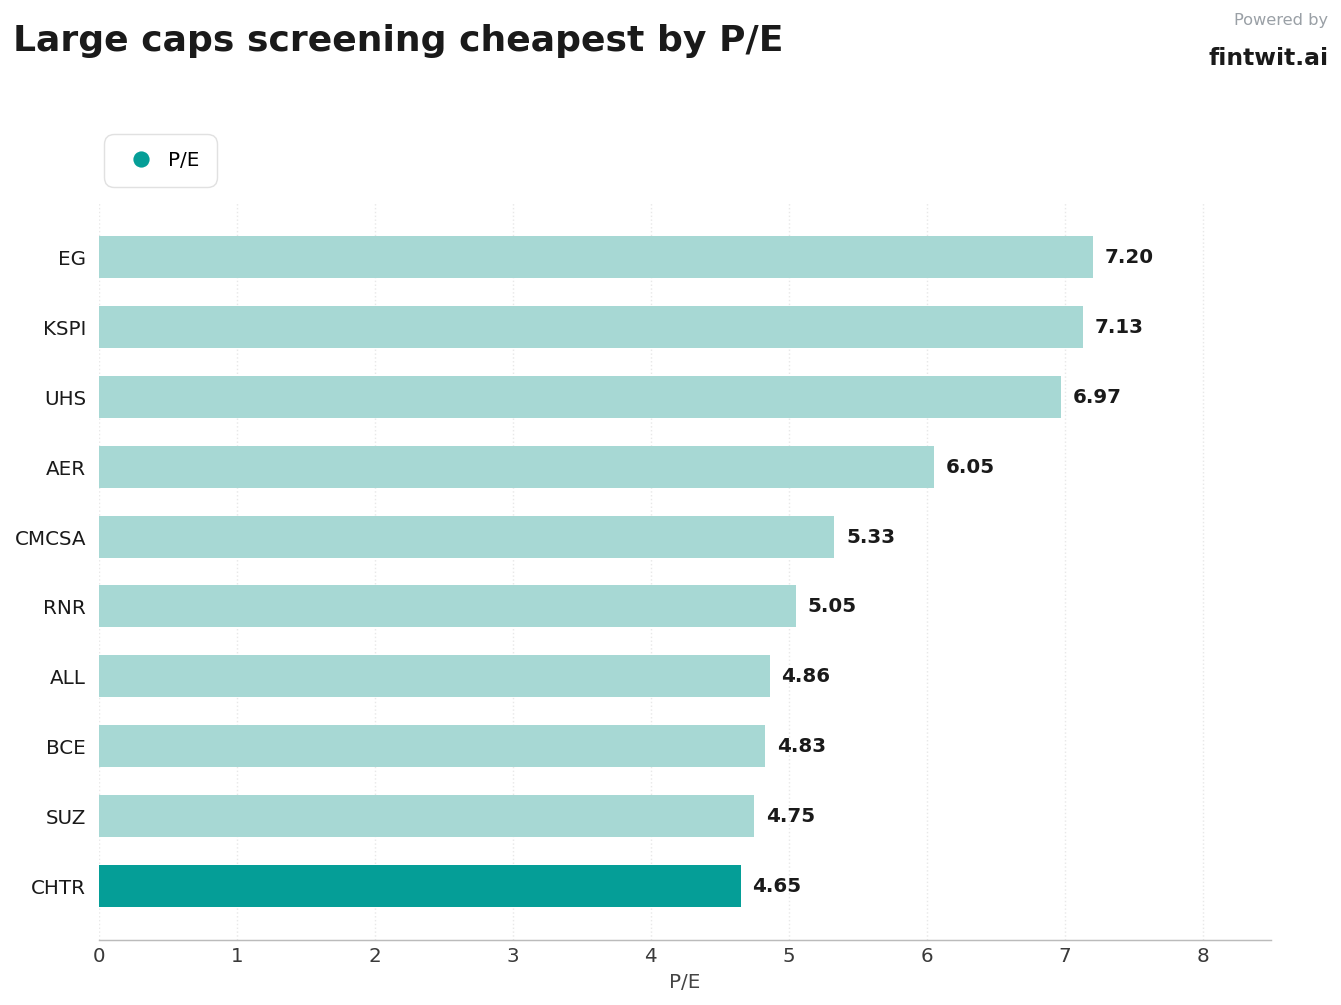
The resulting list highlights companies trading at low multiples, ranging from 4.65x to 7.20x earnings. We categorized these as either structural value plays or potential value traps based on their underlying business health.
- Market cap floor: $10 billion.
- Metric focus: Trailing P/E ratio.
- Exclusion criteria: Companies with negative earnings or extreme volatility that distorts valuation metrics.
The list
The following tickers represent some of the lowest P/E stocks in the current market. Investors should note that low multiples often correlate with high operational risk.
See the chart below for a visual comparison of these valuation multiples.
- CHTR: 4.65 P/E. Why: Broadband losses. Analyst: Faces persistent subscriber churn from 5G competition.
- SUZ: 4.75 P/E. Why: Pulp price cycles. Analyst: Downside is limited as capital allocation matures by 2026.
- BCE: 4.83 P/E. Why: High capex. Analyst: Valuation sits well below 10-year historical averages.
- ALL: 4.86 P/E. Why: Rising claim costs. Analyst: Profitability remains pressured by litigation expenses.
- RNR: 5.05 P/E. Why: Industry sentiment. Analyst: Bullish analysts are leaning positive despite volatility.
- CMCSA: 5.33 P/E. Why: Media decline. Analyst: The market has overshot the repricing of this asset.
- AER: 6.05 P/E. Why: Sector rotation. Analyst: Pressures are sentiment-driven rather than fundamental.
- UHS: 6.97 P/E. Why: Policy headwinds. Analyst: Higher-margin segments face significant regulatory pressure.
- KSPI: 7.13 P/E. Why: Macro uncertainty. Analyst: Priced for geopolitical risks that may be overstated.
- EG: 7.20 P/E. Why: Catastrophe losses. Analyst: Well-positioned to capture above-market premium growth.
Caveats
A low P/E ratio is not a guarantee of future performance. Investors must distinguish between companies that are temporarily mispriced and those in terminal decline.
Capital intensity and debt loads can mask the true cost of equity for these firms.
- High free cash flow yield does not always offset structural revenue loss.
- Regulatory and geopolitical risks can permanently impair earnings power.
- Dividend yields, such as the 9.64% at BCE, may be vulnerable to future cuts if payout ratios become unsustainable.
- Sector rotation into AI and tech has left industrials and telecom stocks undervalued by historical standards.
How to use this screen
Use this list as a starting point for fundamental analysis rather than a buy list. Verify the sustainability of free cash flow before committing capital to low-multiple names.
Compare the current P/E against the company's 5-year historical average to determine if the discount is justified by current performance.
- Check the PEG ratio to see if the low P/E is justified by low growth expectations.
- Monitor quarterly earnings reports for changes in debt-to-equity ratios.
- Assess whether the discount is driven by temporary industry cycles or permanent structural shifts.