Amazon (AMZN) vs Walmart (WMT): Which Retail Giant Is the Better Buy in 2026?
Amazon and Walmart are battling for retail dominance. We break down the financials and growth catalysts to see which stock offers the best path forward.
The matchup
Amazon and Walmart represent two distinct strategies for capturing the modern consumer. Amazon leverages a high-margin ecosystem of cloud computing and advertising, while Walmart relies on its massive physical footprint and grocery dominance.
The competitive landscape has shifted as both companies invest heavily in automation and AI. Amazon's $200 billion annual capital expenditure plan for 2026 underscores its commitment to maintaining leadership in AI infrastructure.
Walmart continues to refine its omnichannel approach, focusing on membership fees and digital marketplace growth to offset the thin margins inherent in traditional retail.
- Amazon: Dominant cloud market share via AWS and a high-margin advertising flywheel.
- Walmart: Unmatched physical proximity to consumers and a resilient grocery-led business model.
- Strategic focus: Amazon prioritizes long-term margin expansion through tech, while Walmart targets efficiency through store-level automation.
Numbers side by side
Financial metrics reveal the divergence between Amazon's growth-focused profile and Walmart's defensive, value-oriented structure.
Amazon's record 13.1% operating margin in Q1 2026 highlights the profitability of its non-retail segments. Walmart maintains tighter margins, typically hovering around 4%, which necessitates high volume to sustain earnings.
Investors must weigh Amazon's higher valuation against its superior growth trajectory compared to Walmart's steady, dividend-supported performance.
- AMZN Price: $232.69; WMT Price: $115.69.
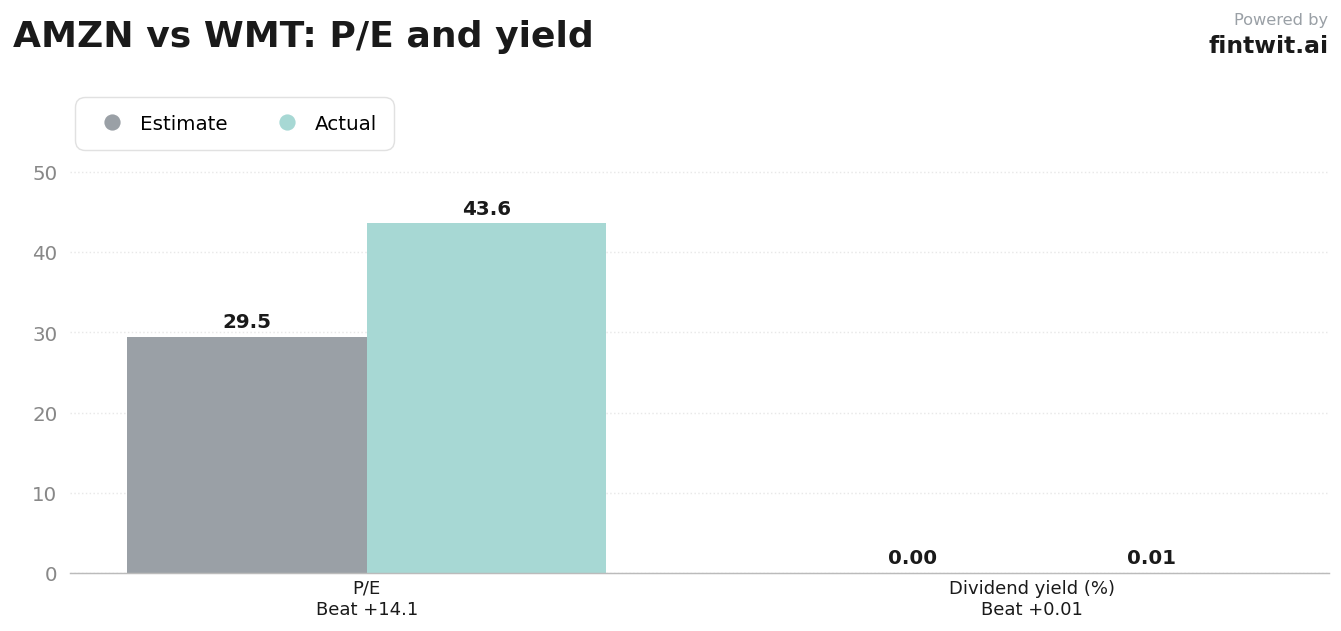
- AMZN P/E Ratio: 29.49; WMT P/E Ratio: 43.60.
- AMZN Revenue Growth: 17% YoY; WMT Revenue Growth: 7.3% YoY.
- AMZN 90-day return: 16.73%; WMT 90-day return: -5.86%.
- WMT Dividend Yield: 0.78%; AMZN Dividend Yield: N/A.
Bull and bear on each
The bull and bear cases for these companies reflect their unique operational risks and opportunities in the current economic climate.
Amazon's path to success is tied to AWS reacceleration and the scaling of its advertising business. Conversely, Walmart's success depends on its ability to navigate consumer trade-down behavior and rising labor costs.
Execution risk remains a primary concern for both, particularly regarding Amazon's massive capital spending and Walmart's ability to maintain pricing power.
- AMZN Bull: AWS leadership in AI (Trainium/Bedrock) and high-margin advertising growth.
- AMZN Bear: $200B annual capex creates free cash flow pressure and regulatory scrutiny.
- WMT Bull: Successful pivot to high-margin membership fees and marketplace revenue.
- WMT Bear: Limited pricing power makes margins sensitive to fuel and labor inflation.
The verdict
Determining the superior investment requires balancing Amazon's aggressive growth against Walmart's defensive stability. Amazon's ability to extract high margins from its cloud and advertising segments provides a distinct advantage in a volatile market.
Walmart remains a compelling option for investors seeking exposure to essential goods and a proven omnichannel strategy. The choice depends on whether an investor prioritizes high-growth tech infrastructure or consistent, value-based retail performance.