The Cheapest Large Caps Right Now: A P/E Screen of SUZ, CHTR, and ALL
A quantitative look at large-cap stocks trading at deep value multiples, focusing on P/E ratios and free cash flow yields.

How we screened
We filtered the universe of large-cap equities to isolate companies trading at a price-to-earnings ratio below 8.0. This screen prioritizes immediate earnings power over speculative growth narratives.
The resulting list highlights sectors currently facing structural headwinds or cyclical downturns. We focused on companies with significant free cash flow generation to ensure the valuation floor is supported by actual liquidity.
- Screen criteria: Market capitalization exceeding $10 billion.
- Valuation metric: Trailing twelve-month P/E ratio under 8.0.
- Data source: Aggregated financial filings and market pricing as of Q3 2024.
The list
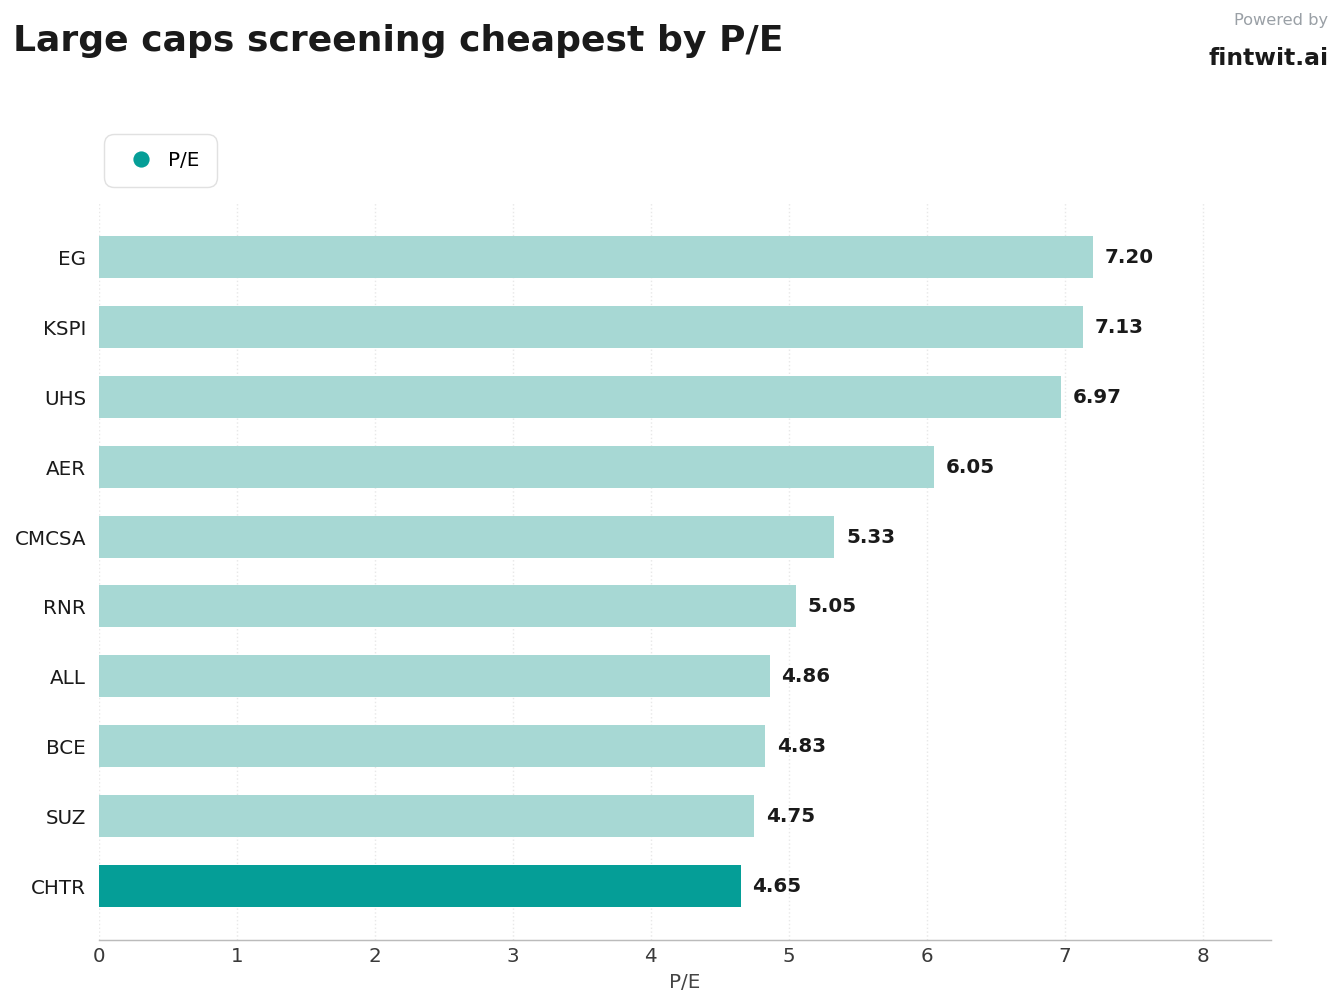
The following companies represent the most compressed valuations within our large-cap universe. Each ticker currently trades at a P/E ratio between 4.65 and 7.20.
These valuations reflect deep skepticism regarding future earnings stability in the telecom and insurance sectors.
- Charter Communications (CHTR): 4.65 P/E. Market fears high debt loads and cord-cutting; analysts note the 14.94% free cash flow yield provides a buffer.
- Suzano (SUZ): 4.75 P/E. Zacks Investment Research assigns a Strong Buy rating, citing a value grade of A and a P/E significantly below the 12.82 industry average.
- BCE Inc (BCE): 4.83 P/E. Investors are wary of capital intensity, yet the 9.64% dividend yield remains a primary focus for income-oriented value managers.
- The Allstate Corporation (ALL): 4.86 P/E. Rising insurance claims have pressured the stock, though a 21.61% free cash flow yield suggests strong operational resilience.
- Renaissancere Holdings (RNR): 5.05 P/E. Reinsurance pricing cycles remain the primary catalyst for this valuation, with a 33.35% free cash flow yield.
- Comcast (CMCSA): 5.33 P/E. High leverage concerns dominate the narrative, despite a 19.28% free cash flow yield and dominant market share.
- AerCap Holdings (AER): 6.05 P/E. Aircraft leasing demand remains high, though investors remain cautious about the cyclical nature of the aviation industry.
- Universal Health Services (UHS): 6.97 P/E. Healthcare facility margins are under pressure from labor costs, but the 7.88% free cash flow yield provides support.
- Kaspi.kz (KSPI): 7.13 P/E. Regional market risks in Kazakhstan drive this valuation, despite the company's dominant fintech ecosystem.
- Everest Group (EG): 7.20 P/E. Reinsurance sector volatility continues to dictate price action, with a 2.26% dividend yield.
Caveats
Low P/E ratios are often a symptom of structural decline rather than market mispricing. Investors must distinguish between temporary cyclical troughs and permanent impairment of the business model.
High free cash flow yields can be misleading if the company is under-investing in necessary capital expenditures. We recommend reviewing the capital allocation strategy for each firm before initiating a position.
- Debt levels: High leverage in telecom names like CHTR and CMCSA amplifies equity volatility.
- Cyclicality: Commodity-linked firms like SUZ are highly sensitive to global pulp price fluctuations.
- Regulatory risk: Insurance providers like ALL and RNR face unpredictable climate-related loss events.
- Liquidity: Some ADRs on this list may experience lower trading volumes compared to domestic large caps.
How to use this screen
Use this list as a starting point for fundamental due diligence rather than a list of actionable buy recommendations. The next step is to analyze the debt maturity schedule for the telecom holdings.
Compare the current free cash flow yield against the historical five-year average for each company. A significant deviation from the mean often signals a potential change in the underlying business trajectory.
- Verify the sustainability of the dividend payout ratio for high-yield names like BCE.
- Assess the impact of rising interest rates on the cost of debt for capital-intensive industries.
- Monitor quarterly earnings reports for signs of margin expansion or contraction.