Amazon.com Inc (AMZN) vs Walmart Inc. (WMT): Which Is the Better Buy in 2026?
Amazon and Walmart represent two distinct paths to retail dominance. We analyze the growth potential of AMZN versus the defensive stability of WMT.
The matchup
Amazon operates as a hybrid technology and retail conglomerate, deriving its primary value from the AWS cloud infrastructure and a high-margin advertising business. The company is currently scaling its proprietary AI silicon, including Trainium and Graviton chips, to improve operating leverage.
Walmart maintains a defensive posture, leveraging its massive physical footprint and omnichannel digital ecosystem to capture grocery market share. The company is currently integrating AI-driven supply chain automation to combat rising SG&A costs.
- Amazon's moat is built on the integration of AWS, a third-party marketplace, and advertising.
- Walmart's moat relies on its physical store network and the Walmart+ membership program.
- Amazon faces significant CapEx intensity, with $200 billion in annual spending impacting short-term free cash flow.
- Walmart faces structural margin constraints inherent to its price-leadership model.
Numbers side by side
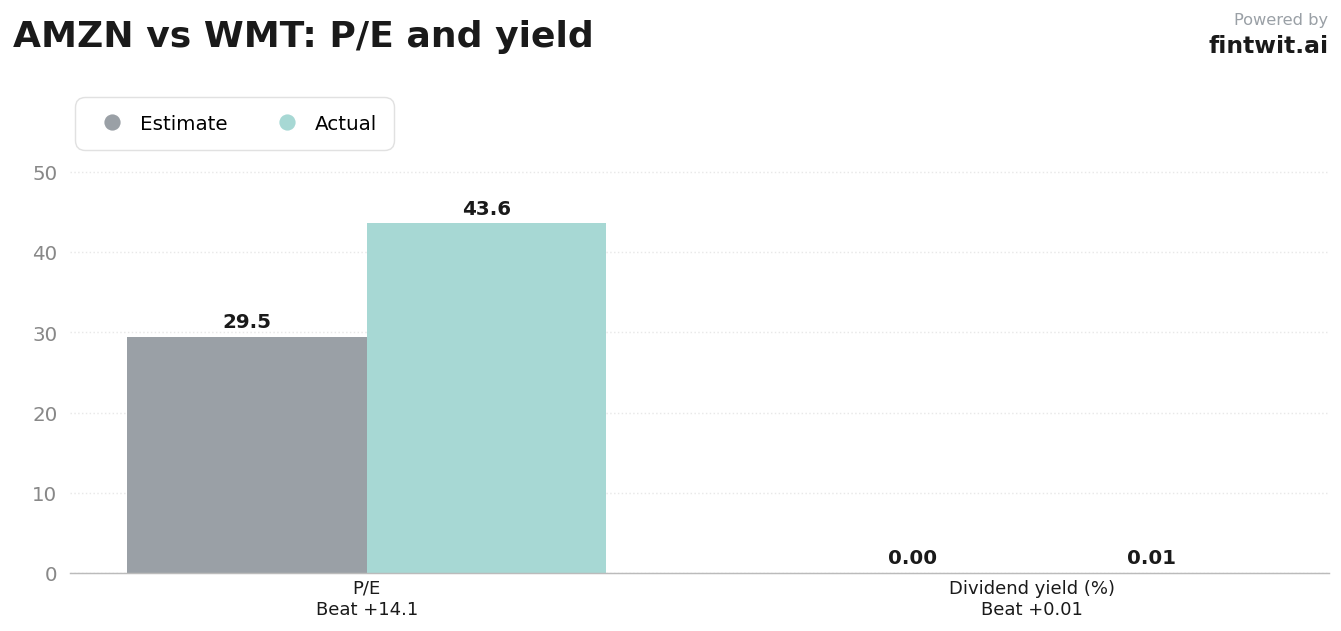
Financial metrics reveal the distinct operational profiles of these two retail titans. Amazon trades at a P/E ratio of 29.49, reflecting its growth-oriented valuation, while Walmart trades at 43.60, indicating a premium for its defensive stability.
See the valuation-side-by-side chart below for a direct comparison of these key performance indicators.
- AMZN Price: $242.67; WMT Price: $111.84.
- AMZN P/E Ratio: 29.49; WMT P/E Ratio: 43.60.
- AMZN 1-Year Return: 8.62%; WMT 1-Year Return: 13.70%.
- AMZN 90-Day Return: 15.68%; WMT 90-Day Return: -11.09%.
- WMT Dividend Yield: 0.78%; AMZN Dividend Yield: N/A.
Bull and bear on each
Analyst sentiment is split across the board as firms weigh the impact of AI investments against macroeconomic headwinds. The following breakdown summarizes the core arguments for both companies.
- AMZN Bull: AWS re-acceleration driven by AI demand and custom silicon cost advantages.
- AMZN Bull: Operating margin expansion as high-margin advertising becomes a larger revenue mix.
- AMZN Bear: Massive $200B annual CapEx intensity pressuring near-term free cash flow.
- AMZN Bear: Regulatory risks impacting marketplace operations and seller relationships.
- WMT Bull: Successful transition to a technology-driven omnichannel powerhouse.
- WMT Bull: Defensive retail strength providing stability across economic cycles.
- WMT Bear: Structural margin constraints due to price-leadership model limiting pricing power.
- WMT Bear: Potential for profit mix stagnation if high-margin segments fail to scale.
- Benchmark (AMZN): Bullish, $370 target.
- DA Davidson (AMZN): Bearish/Cautious, $175 target.
- Tigress Financial (WMT): Bullish, $155 target.
- Wolfe Research (WMT): Cautious, $112 target.
The verdict
The choice between these two depends on whether an investor prioritizes high-growth cloud and advertising exposure or defensive retail stability. Amazon offers a more aggressive path to margin expansion, while Walmart provides a compounding floor through its grocery dominance.
Investors should monitor the upcoming quarterly earnings reports to see if Amazon's CapEx intensity yields the expected FCF growth or if Walmart's margin compression reverses through automation gains.